
Personal Rapid Transit
Personal rapid transit (PRT), also called personal automated transport (PAT) or podcar, is a public transportation mode featuring small automated vehicles operating on a network of specially-built guide ways. PRT is a type of automated guideway transit (AGT), which also includes systems with larger vehicles, all the way to small subway systems.
In PRT designs, vehicles are sized for individual or small group travel, typically carrying no more than 3-6 passengers per vehicle. Guide ways are arranged in a network topology, with all stations located on sidings, and with frequent merge/diverge points. This approach allows for nonstop, point-to-point travel, bypassing all intermediate stations. The point-to-point service has been compared to a taxi and a horizontal lift.
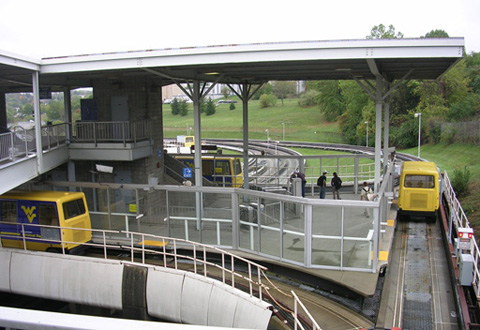
PRT was a major area of study in the 1960s and 1970s. In 1975, Morgantown PRT, an experimental automated system which exhibits some (but not all) features of PRT, was opened to the public after significant construction cost overruns. Morgantown PRT remains in use today, and there have been discussions on expanding it.
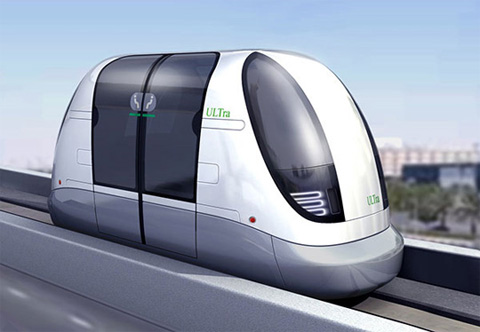
As of September 2010, no other PRT systems are open to the public. Several test tracks are operational and undergoing active testing. A pilot system at London Heathrow Airport, United Kingdom, was constructed using the ULTra design, though it has not yet opened to the public. Several cities have recently expressed interest in PRT, and two small city-based systems are currently in development, in Suncheon, South Korea and Amristar, India.
| Similar to automobiles |
|
| Similar to trams, buses, and monorails |
|
| Similar to automated people movers |
|
| Distinct features |
|
Infrastructure design
Guideways
There is some debate over the best type of guideway. Among the proposals are beams similar to monorails, bridge-like trusses supporting internal tracks, and cables embedded in a roadway. Most designs put the vehicle on top of the track, which reduces visual intrusion and cost as well as easing ground-level installation. An overhead track is necessarily higher, but may also be narrower. Most designs use the guideway to distribute power and data communications, including to the vehicles.
Stations
Proposals usually have stations close together, and located on side tracks so that through traffic can bypass vehicles picking up or dropping off passengers. Each station might have multiple berths, with perhaps one-third of the vehicles in a system being stored at stations waiting for passengers. Stations are envisioned to be minimalistic, without facilities such as rest rooms. For elevated stations, an elevator may be required for accessibility.
Operational characteristics
Headway distance
Spacing of vehicles on the guideway influences the maximum passenger capacity of a track, so designers prefer smaller headway distances. Computerized control theoretically permits closer spacing than the two-second headways recommended for cars at speed, since multiple vehicles can be braked simultaneously. There are also prototypes for automatic guidance of private cars based on similar principles.
Very short headways are controversial. The UK Railway Inspectorate has evaluated the ULTra design and is willing to accept one-second headways, pending successful completion of initial operational tests at more than 2 seconds. In other jurisdictions, existing rail regulations apply to PRT systems (see CVS, above); these typically calculate headways in terms of absolute stopping distances, which would restrict capacity and make PRT systems unfeasible. No regulatory agency has yet endorsed headways below one second, although proponents believe that regulators may be willing to reduce headways as operational experience increases.
Capacity
PRT is usually proposed as an alternative to rail systems, so comparisons tend to be with rail. PRT vehicles seat fewer passengers than trains and buses, and must offset this by combining higher average speeds, diverse routes, and shorter headways. Proponents assert that equivalent or higher overall capacity could be achieved by these means. Since there are no full-scale installations, capacity calculations are based on simulation and modeling.
Single line capacity
With two-second headways and four-person vehicles, a single PRT line can achieve theoretical maximum capacity of 7,200 passengers per hour. However, most estimates assume that vehicles will not generally be filled to capacity, due to the point-to-point nature of PRT. At a more typical average vehicle occupancy of 1.5 persons per vehicle, the maximum capacity is 2,700 passengers per hour. Some researchers have suggested that rush hour capacity can be improved if operating policies support ridesharing.
Capacity is inversely proportional to headway. Therefore, moving from two-second headways to one-second headways would double PRT capacity. Half-second headways would quadruple capacity. Theoretical minimum PRT headways would be based on the mechanical time to engage brakes, and these are much less than a half second. Although no regulatory agency has as yet (June 2006) approved headways shorter than two seconds, researchers suggest that high capacity PRT (HCPRT) designs could operate safely at half-second headways.
In simulations of rush hour or high-traffic events, about one-third of vehicles on the guideway need to travel empty to resupply stations with vehicles in order to minimize response time. This is analogous to trains and buses travelling nearly empty on the return trip to pick up more rush hour passengers.
Grade separated light rail systems can move 15,000 passengers per hour on a fixed route, but these are usually fully grade separated systems. Street level systems typically move up to 7,500 passengers per hour. Heavy rail subways can move 50,000 passengers per hour. As with PRT, these estimates depend on having enough trains. Neither light nor heavy rail scales well for off-peak operation.
Networked PRT capacity
The above discussion compares line or corridor capacity and may therefore not be relevant for a networked PRT system, where several parallel lines (or parallel components of a grid) carry traffic. In addition, Muller estimated[50] that while PRT may need more than one guideway to match the capacity of a conventional system, the capital cost of the multiple guideways may still be less than that of the single guideway conventional system. Thus comparisons of line capacity should also consider the cost per line.
PRT systems should require much less horizontal space than existing metro systems, with individual cars being typically around 50% as wide for side-by-side seating configurations, and less than 33% as wide for single-file configurations. This is an important factor in densely-populated, high-traffic areas.
Travel speed
For a given peak speed, nonstop journeys are about three times as fast as those with intermediate stops. This is not just because of the time for starting and stopping. Scheduled vehicles are also slowed by boardings and exits for multiple destinations.
Therefore, a given PRT seat transports about three times as many passenger miles per day as a seat performing scheduled stops. So PRT should also reduce the number of needed seats threefold for a given number of passenger miles.
While a few PRT designs have operating speeds of 100 km/h (60 mph), and one as high as 241 km/h (150 mph),[51] most are in the region of 40–70 km/h (25–45 mph). Rail systems generally have higher maximum speeds, typically 90–130 km/h (55–80 mph) and sometimes well in excess of 160 km/h (100 mph), but average travel speed is reduced about threefold by scheduled stops and passenger transfers.
Ridership attraction
If PRT designs deliver the claimed benefit of being substantially faster than cars in areas with heavy traffic, simulations suggest that PRT could attract many more automobile drivers than other public transit systems. Standard mass transit simulations accurately predict that 2% of auto drivers will switch to trains. These same methods predict that 25% to 60% of auto drivers would switch to PRT.[citation needed]
Control algorithms
The typical control algorithm places vehicles in imaginary moving “slots” that go around the loops of track. Real vehicles are allocated a slot by track-side controllers. On-board computers maintain their position by using a negative feedback loop to stay near the center of the commanded slot. One way vehicles can measure their position is to add up the distance from odometers, with periodic check points to compensate for cumulative errors.[35] Next-generation GPS and radio location can also be used for accurate positioning.
Another style of control assigns a path and speed to a vehicle, after verifying that the path does not violate the safety margins of other vehicles. This permits system speeds and safety margins to be adjusted to design or operating conditions, and may use slightly less energy.[52] The maker of the ULTra PRT system reports that testing of its control system shows lateral (side-to-side) accuracy of 1 cm, and docking accuracy better than 2 cm.
Safety
Computer control eliminates human-driver errors, so PRT designs in a controlled environment should be much safer than private motoring on roads. Most designs enclose the running gear in the guideway to prevent derailments. Grade-separated guideways would prevent conflict with pedestrians or manually-controlled vehicles. Other public transit safety engineering approaches, such as redundancy and self-diagnosis of critical systems, are also included in designs.
The Morgantown system, more correctly described as an Automated Guideway Transit system (AGT), has completed 110 million passenger-miles without serious injury. According to the U.S. Department of Transportation, AGT systems as a group have higher injury rates than any other form of rail-based transit (subway, metro, light rail, or commuter rail) though still much better than ordinary buses or automobiles. More recent research by the British company ULTra PRT reported that AGT systems have a better safety than more conventional, non-automated modes.
As with many current transit systems, personal passenger safety concerns are likely to be addressed through CCTV monitoring[citation needed], and communication with a central command center from which engineering or other assistance may be dispatched.
Energy efficiency
The energy efficiency advantages claimed by PRT proponents include two basic operational characteristics of PRT: an increased average load factor; and the elimination of intermediate starting and stopping.
Average load factor, in transit systems, is the ratio of the total number of riders to the total theoretical capacity. A transit vehicle running at full capacity has a 100% load factor, while an empty vehicle has 0% load factor. If a transit vehicle spends half the time running at 100% and half the time running at 0%, the average load factor is 50%. Higher average load factor corresponds to lower energy consumption per passenger, so designers attempt to maximize this metric.
Scheduled mass transit (i.e. buses or trains,) trades off service frequency and load factor. Buses and trains must run on a predefined schedule, even during off-peak times when demand is low and vehicles are nearly empty. So to increase load factor, transportation planners try to predict times of low demand, and run reduced schedules or smaller vehicles at these times. This increases passengers’ wait times. In many cities, trains and buses do not run at all at night or on weekends.
PRT vehicles, in contrast, would only move in response to demand, which places a theoretical lower bound on their average load factor. This allows 24-hour service without many of the costs of scheduled mass transit.
ULTra PRT estimates its system will consume 839 BTU per passenger mile (0.55 MJ per passenger km). By comparison, automobiles consume 3,496 BTU, and personal trucks consume 4,329 BTU per passenger mile.
Due to PRT’s efficiency, some proponents say solar becomes a viable power source.PRT elevated structures provide a ready platform for solar collectors, therefore some proposed designs include solar power as a characteristic of their networks.
For bus and rail transit, energy usage per passenger-mile is dependent on service frequency and ridership, and can vary significantly from peak to non-peak. Therefore, aggregate statistics are used to calculate overall energy usage passenger-mile. In the US, buses consume an average of 4,318 BTU/passenger-mile, transit rail 2,750 BTU/passenger-mile, and commuter rail 2,569 BTU/passenger-mile.
Cost characteristics
The initial capital costs of PRT are large, but compare favorably with those of other transportation modes. Its system design tries to pay down those costs as quickly as possible, while maximizing the useful lifetime of the project. Proponents’ cost estimates in passenger mile range from the cost of a bicycle (US $0.01–0.05/passenger-mile, Unimodal) to the cost of a small motorcycle ($0.20/passenger mile, TAXI 2000), and are strongly disputed by opponents. It’s agreed that PRT systems require no individual license, parking or insurance fees, and buy energy in bulk from inexpensive providers.
Most of the initial investment is in guideways. Estimates of guideway cost range from US$0.8 million (for MicroRail) to $22 million per mile, with most estimates falling in the $10m to $15m range. These costs may not include the purchase of rights of way or system infrastructure, such as storage and maintenance yards and control centers, and reflect unidirectional travel along one guideway, the standard form of service in current PRT proposals. Bidirectional service is normally provided by moving vehicles around the block. To reach capacities of competing systems, a system requires thousands of vehicles. Some PRT proposals incorporate these costs in their per-mile estimates.
PRT designs generally assume dual-use rights of way, for example by mounting the transit system on narrow poles on an existing street. If dedicated rights of way were required for an application, costs could be considerably higher. If tunneled, small vehicle size can reduce tunnel volume compared with that required for an automated people mover (APM). Dual mode systems would use existing roads, as well as special-purpose PRT guideways. In some designs the guideway is just a cable buried in the street (a technology proven in industrial automation). Similar technology could equally be applied to private automobiles.
A design with many modular components, mass production, driverless operation and redundant systems should in theory result in low operating costs and high reliability. Predictions of low operating cost generally depend on low operations and maintenance costs. Whether these assumptions are valid will not be known until full scale operations are commenced since reliability cannot be proven by prototype systems.
Transportation systems allocate the cost of their roads by measuring wear. PRT routes are disaggregated, and vehicles only move to carry passengers, so PRT measures wear and energy based on passengers or weight carried, rather than vehicle schedules. This brings large theoretical savings compared to trains, but appears more expensive than buses and streetcars, whose roads are subsidized by sunk, preallocated fuel taxes.
So, some planners dispute the cost-estimates of PRT when compared to light rail systems, whose costs vary widely with non-grade-separated streetcars being relatively low cost and systems involving elevated track or tunnels costing up to US$200 million per mile.